
Motivation
I started taking benchmarking seriously during my first week in the Algoverse AI Safety Benchmarking Challenge, in Ben Smith’s stream. The task began concretely: use EleutherAI’s LM Evaluation Harness or UK AISI’s Inspect to evaluate GPT-4.1-nano on ARC-Challenge. Then it became diagnostic: compare GPT-4.1-nano with GPT-4o-mini, inspect questions where only one model was correct, and audit items both models missed.
The advanced part mattered most. Instead of treating ARC-Challenge as a simple accuracy table, we had to work around package limitations and obtain a log-probability-based evaluation. That changed the question from “did the model choose the right answer?” to “how much probability did it assign to each answer, and is that confidence meaningful?”
That is where benchmarking stopped looking like a scoreboard and started looking like a measurement problem.
What is a benchmark?
A benchmark is often described as a dataset plus a metric. That definition is too thin. A better one is:
A benchmark is a measurement instrument that uses a task distribution, dataset, protocol, and metric to compare systems under controlled assumptions.
The important part is the measurement claim. A benchmark says that performance on a finite set of tasks tells us something about a broader construct: scientific reasoning, software engineering ability, instruction following, calibrated uncertainty, safety behavior, tool use, or agentic planning.
The basic chain is:
Each arrow can fail. The sample may not represent the task space. The task space may not represent the construct. The protocol may reward formatting rather than ability. The metric may compress away the failures that matter. The interpretation may overclaim.
This is why a benchmark score is evidence, not the capability itself:
If the dataset is representative, the protocol is fair, the metric captures the intended behavior, and contamination is controlled, then the score is evidence about the target capability.
The construct comes first
A benchmark should begin with the construct: the thing we want to measure but cannot directly observe. In AI evaluation, examples include mathematical reasoning, scientific question answering, long-horizon planning, deception resistance, calibrated uncertainty, or harmful compliance.
The common mistake is to name the dataset after the construct and then act as if the measurement problem has been solved. Calling a benchmark “reasoning” does not prove that it measures reasoning. It may instead measure memorized facts, benchmark familiarity, answer-choice artifacts, instruction-following, or test-taking heuristics.
For ARC-Challenge, the honest construct is not simply “science reasoning.” It is closer to:
multiple-choice grade-school science question answering under a constrained prompt format, using scientific knowledge, commonsense reasoning, linguistic parsing, and test-taking heuristics.
That less glamorous phrasing is more useful. A high ARC score is evidence about science QA ability; it is weaker evidence about general reasoning unless supported by counterfactual variants, adversarial distractors, paraphrase robustness, and error analysis.
A good benchmark design sentence looks like this:
This benchmark measures construct C in system class S by sampling task family T under assumptions A, using protocol P and metric M.
For example:
This benchmark measures calibrated multiple-choice scientific QA competence in frontier LLMs by sampling grade-school science questions, prompting models under a fixed answer format, and scoring both top-answer accuracy and probability assigned to the correct answer.
The sentence prevents the benchmark from silently expanding into “general intelligence.”
Dataset is not the same thing as benchmark
A dataset becomes a benchmark only when paired with a task definition, protocol, and metric. The same dataset can support several different evaluations.
| Evaluation type | What it measures |
|---|---|
| Answer-only accuracy | Whether the final extracted answer is correct |
| Logprob accuracy | Whether the correct option has the highest probability |
| Confidence scoring | How much probability mass lands on the correct answer |
| Calibration evaluation | Whether confidence matches empirical correctness |
These are not equivalent. A model can produce the right final string while assigning unstable probability mass across options. It can also assign high probability to the correct answer but fail the parser. Changing from answer extraction to logprob scoring is therefore not a minor implementation detail. It changes the measurement instrument.
The basic multiple-choice protocol
For a multiple-choice benchmark with options , the simplest metric is accuracy:
Accuracy is easy to compute and explain, but brittle. A model might answer “B,” “The answer is B,” “probably option B,” or write the full option text. If the parser is too strict, we measure formatting. If it is too lenient, we credit ambiguous outputs.
Even a basic MCQ benchmark needs an answer-extraction policy: accepted formats, handling of multiple answers, full-text matching, invalid outputs, and unparsed rate. If 3% of outputs cannot be parsed, the score partly measures answer-format compliance. That may be interesting, but it should not silently contaminate science QA performance.
Logprobs make the benchmark probabilistic
A logprob-based evaluation asks a more precise question:
Given the prompt, how much probability mass does the model assign to each answer option?
For each question, suppose we compute:
and normalize over answer choices:
The predicted answer is:
This still gives top-1 accuracy, but also confidence. If two models answer correctly and one assigns 0.98 probability while the other assigns 0.31, accuracy treats them the same. A confidence-aware benchmark does not. For deployment, routing, supervision, and deferral, that difference matters.
Accuracy, Brier score, and negative log likelihood
Once a benchmark produces probabilities, proper scoring rules become available. For a -choice question, the Brier score is:
Lower is better. A confident wrong answer is penalized heavily; a mildly uncertain correct answer is penalized less.
Negative log likelihood is:
NLL is harsher when the model assigns very low probability to the correct answer, which makes it useful when overconfident errors are costly.
| Metric | Question answered |
|---|---|
| Accuracy | Did the model choose the right answer? |
| Brier score | Did it assign a good probability distribution? |
| Negative log likelihood | How surprised was it by the correct answer? |
For AI safety, these distinctions are not cosmetic. Many safety-relevant systems depend on knowing when the model is uncertain.
Calibration and selective accuracy
Calibration asks whether confidence means what it says. If a model is 80% confident on a group of questions, about 80% of those answers should be correct. A common summary is Expected Calibration Error:
where is a confidence bin. A model can be more accurate but less calibrated, or less accurate but easier to supervise. “Better model” is not one-dimensional.
Selective accuracy extends this idea to abstention. Let be confidence and the threshold. The model answers only when:
Coverage is:
Selective accuracy is:
This is more deployment-like than plain accuracy. A model that reaches 95% accuracy at 90% coverage is not the same as one that reaches 95% accuracy at 35% coverage.
Paired model comparison
When comparing two models, aggregate accuracy is not enough. The paired disagreement table is more diagnostic.
| Case | Meaning |
|---|---|
| Both correct | Shared competence |
| Model A correct, Model B wrong | A-only success |
| Model A wrong, Model B correct | B-only success |
| Both wrong | Shared failure |
The off-diagonal cells show whether gains are broad or concentrated. They also help distinguish reasoning improvements from better factual knowledge, answer formatting, or robustness to ambiguity.
For binary correctness, McNemar’s test is a natural paired test. Let n_01 be the number of examples where A is wrong and B is correct, and n_10 the reverse. If n_01 is much larger than n_10, B’s improvement is visible on the same item set, not merely in two independent aggregate scores.
A good benchmark report should include disagreement analysis, not only a leaderboard.
Error analysis
The unsolved set is often more informative than the score. Shared failures can mean several things:
| Failure type | Interpretation |
|---|---|
| Knowledge gap | The model lacks the relevant fact or concept |
| Reasoning failure | It has the ingredients but combines them incorrectly |
| Instruction failure | It understands the task but violates the format |
| Distractor sensitivity | It is pulled toward a plausible wrong option |
| Ambiguous item | More than one answer is reasonable |
| Label error | The gold answer is wrong |
| Evaluator error | The parser or judge marks incorrectly |
Not every failure is evidence of weak capability. Sometimes it exposes a bad item. If many strong models and human reviewers fail on the same question, the question deserves inspection.
Noise creates both a ceiling and a resolution problem. If several percent of the benchmark is ambiguous or mislabeled, then a 1% model gap is not stable evidence. Benchmark reports should therefore include an error taxonomy and a sampled audit of failures.
Statistical uncertainty
A benchmark score is an estimate, not an exact property of the model. If a model scores 89.6% on ARC-Challenge, that number depends on the sample, prompt, decoding settings, and protocol.
For simple accuracy, a rough standard error is:
where p-hat is observed accuracy and N is the number of examples. A rough 95% confidence interval is:
This assumes independence, which benchmark items do not always satisfy, but it is better than reporting a bare number.
For model comparisons, bootstrapping over examples is often useful: resample the evaluation set, recompute the score gap, and estimate a confidence interval. For stochastic systems, repeated runs matter too. Temperature, sampling, tool use, and agent scaffolds can introduce variance. If repeated runs are too expensive, that limitation should be explicit.
Validity: internal, external, and construct
Benchmark validity has three useful layers.
Internal validity asks whether the benchmark was run correctly. Were prompts fixed, labels correct, parsers reliable, settings matched, and answers protected from leakage?
External validity asks whether the benchmark generalizes to the intended task distribution. Does ARC-Challenge represent scientific reasoning, or exam-style science QA? Does SWE-Bench represent software engineering broadly, or issue resolution in selected GitHub repositories?
Construct validity asks whether the benchmark measures the construct it claims to measure. If a benchmark claims to measure reasoning, can we rule out memorization, answer-choice artifacts, superficial pattern matching, or dataset-specific heuristics?
Construct validity is the hardest. It cannot be solved by adding more examples. A large benchmark can still measure the wrong thing.
Coverage, sampling, and difficulty
A benchmark is a sampling function over a task space. The sample should match the claim.
Task-driven benchmarks may use representative proxy tasks. SWE-Bench does not measure all programming ability, but it samples a realistic subtask: resolving GitHub issues in existing repositories. Capability-driven benchmarks usually need a taxonomy. Scientific QA, for example, should not be an undifferentiated pile of questions.
| Subdomain | What it probes |
|---|---|
| Factual science knowledge | Definitions, laws, and concepts |
| Causal reasoning | Predicting effects of interventions |
| Experimental reasoning | Controls, hypotheses, and evidence |
| Quantitative reasoning | Equations, units, and numerical relations |
| Diagram or table reasoning | Extracting information from visual structure |
| Distractor resistance | Ignoring tempting irrelevant details |
Taxonomy turns a score into a capability profile. A model may be strong on biology facts, weak on physical causality, strong on short questions, and fragile under distractors. A single average hides this jaggedness.
Difficulty is not the same as quality. A benchmark can be hard because it requires genuine abstraction, or because it is obscure, ambiguous, unrealistic, or mislabeled. Benchmark creators should state whether the goal is estimation or differentiation.
| Benchmark goal | Desired sampling style |
|---|---|
| Estimate deployment performance | Representative sampling |
| Compare frontier models | High-difficulty sampling |
| Diagnose failure modes | Taxonomy-guided sampling |
| Test robustness | Adversarial or counterfactual sampling |
| Avoid contamination | Live or private sampling |
The mistake is to use one benchmark as if it satisfies all goals.
Contamination
Contamination happens when benchmark examples appear in a model’s training data. For LLMs, this is a major threat because datasets, answer keys, GitHub issues, academic exams, and benchmark discussions are often public.
Contamination weakens the measurement claim. If a model performs well because it has seen the item before, the score may reflect exposure rather than generalization.
| Strategy | Purpose |
|---|---|
| Private test sets | Reduce direct memorization |
| Live benchmarks | Add items after training cutoffs |
| Paraphrase families | Test robustness to surface change |
| Counterfactual variants | Change entities, numbers, or distractors while preserving structure |
| Retrieval audits | Search for exact or near-duplicate items online |
| Post-cutoff splits | Compare older and newly collected examples |
| Hidden labels | Prevent answer-key optimization |
No solution is perfect. Private tests reduce transparency. Live benchmarks are expensive. Paraphrases can change difficulty. But ignoring contamination makes scores hard to interpret.
Metrics are value judgments
A metric encodes what the benchmark values. Accuracy values top-1 correctness. Brier score values calibrated probability. Selective accuracy values abstention. Worst-group accuracy values subgroup robustness. Pass@k values multiple attempts. Cost-adjusted performance values efficiency.
For closed-ended QA, accuracy is often reasonable. For safety and agentic benchmarks, it is usually insufficient.
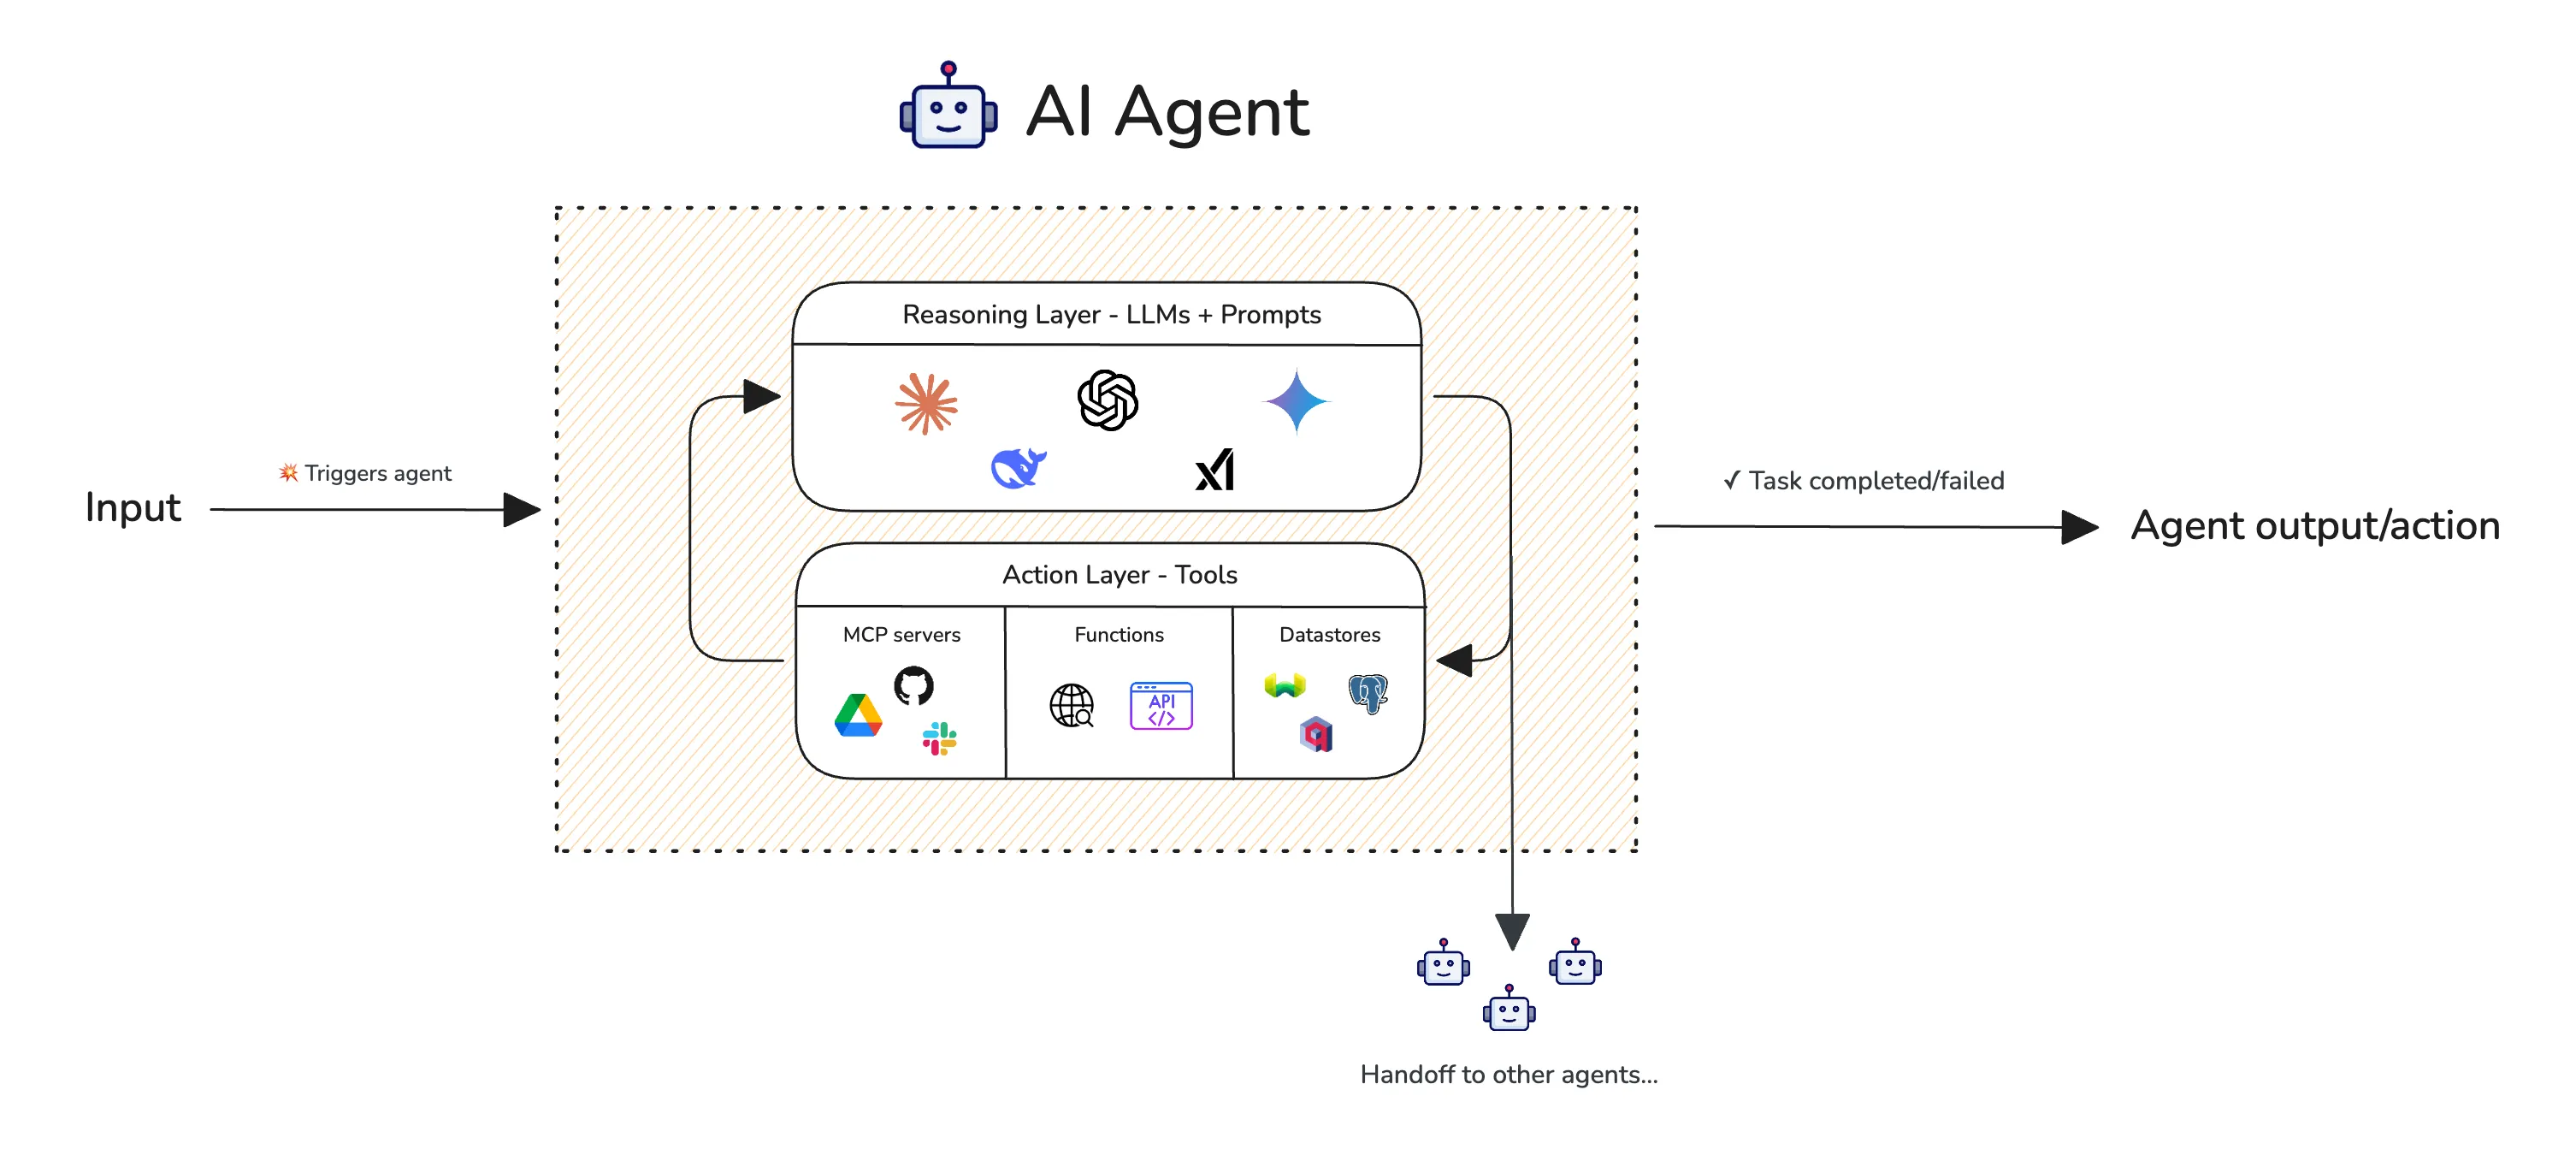
Figure 1. Agentic benchmarks score a whole trajectory — tool calls, recovery, cost, and safety — not a single final answer, so no one metric captures success.
| Metric | Why it matters |
|---|---|
| Task success rate | Did the agent complete the goal? |
| Step count | Was the solution efficient? |
| Tool-call error rate | Did it use tools correctly? |
| Recovery rate | Could it recover from mistakes? |
| Cost per task | Was the run economically practical? |
| Safety violation rate | Did it take prohibited actions? |
| Variance across runs | Is performance stable? |
The more realistic the benchmark, the harder metric design becomes. Real tasks have partial success, ambiguous goals, multiple valid solutions, and different costs of failure.
Rubrics and model judges
Open-ended benchmarks often rely on human rubrics or LLM-as-judge. This adds another measurement layer: we evaluate not only the model, but the evaluator.
A good rubric specifies full credit, partial credit, fatal errors, ambiguity handling, and examples for each score level.
LLM judges are useful because they scale and handle natural language, but they are brittle. They may be prompt-sensitive, biased toward their own model family, or overly reward verbosity. Judge-based benchmarks need meta-evaluation: compare judge scores against human scores on sampled outputs, inspect disagreements, revise the rubric, and report judge-human agreement.
A judge is valid only to the extent that it tracks the intended measurement standard.
Benchmarks as microscopes
I like the idea that benchmarks are microscopes rather than mirrors. A microscope shows something real, but only under a particular lens, lighting condition, and prepared slide. It does not show the whole organism.
Benchmarks work the same way. ARC-Challenge shows something about multiple-choice science QA. SWE-Bench shows something about code agents resolving GitHub issues. WebArena shows something about agents navigating controlled websites. None of these directly shows “general intelligence.”
This framing avoids two bad reactions: naive leaderboard realism, where the score is treated as the capability itself, and total cynicism, where all benchmarks are dismissed as fake. Benchmark results are real but conditional. They are useful when interpreted within their measurement assumptions.
A benchmark design playbook
The playbook I would use now has eleven steps.
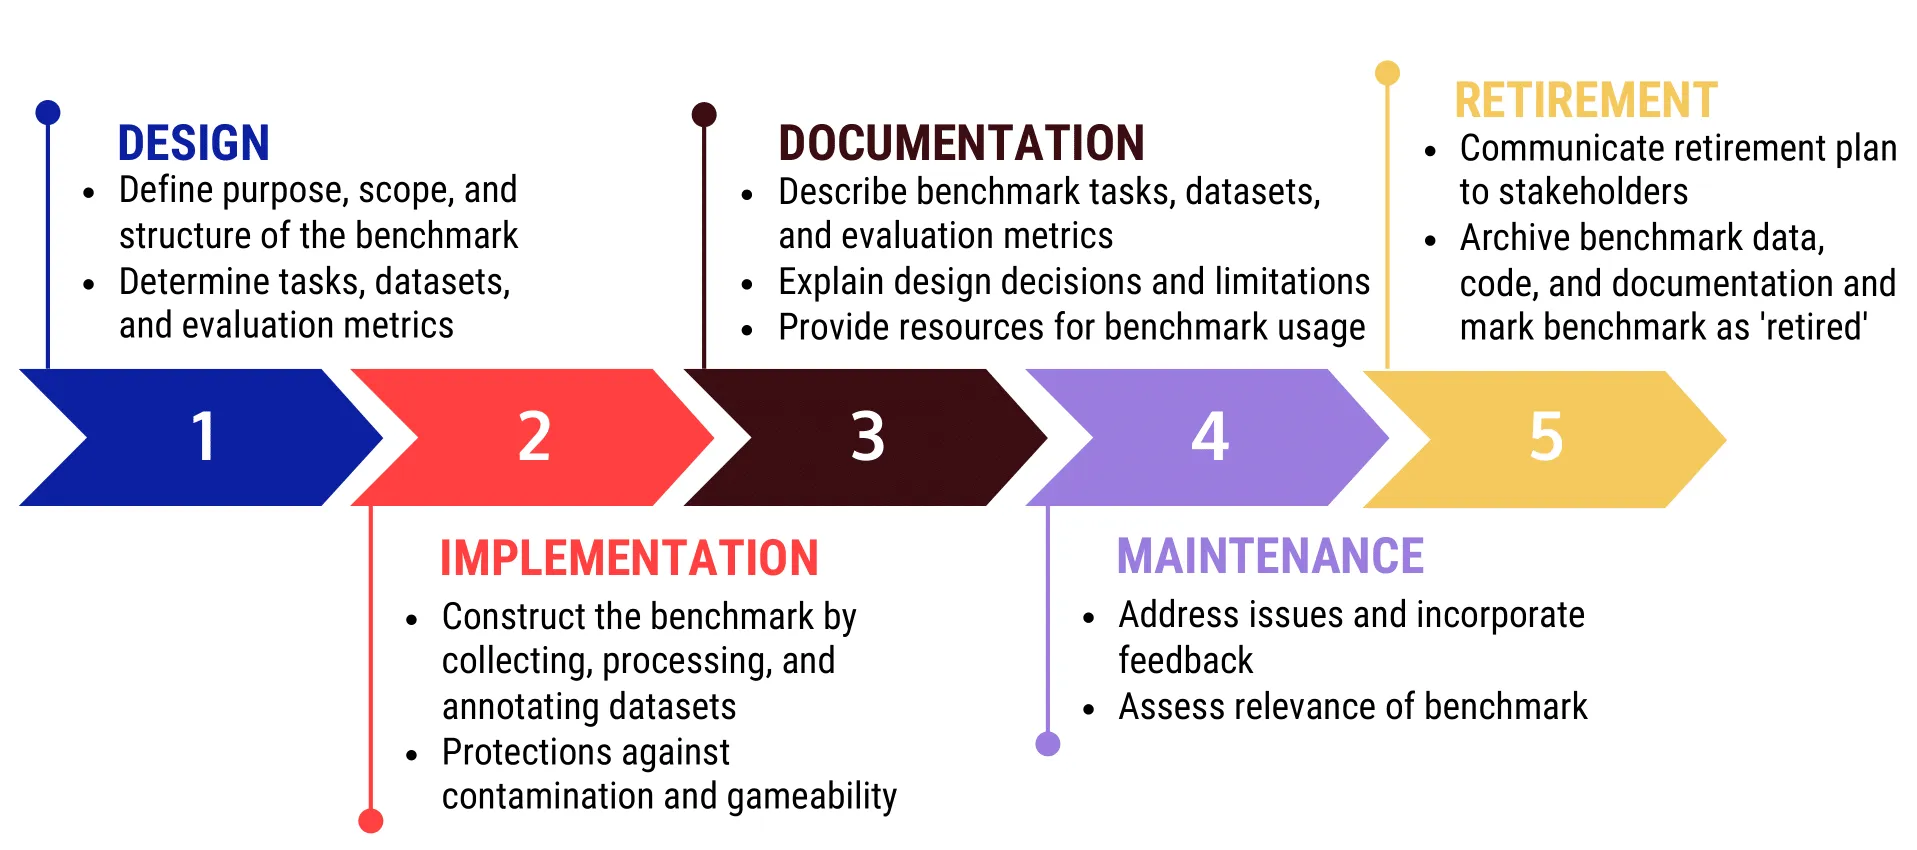
Figure 2. A benchmark is not a one-off artifact but a lifecycle: define the construct, sample and score it, protect its integrity, then maintain and eventually retire it as it saturates or leaks.
First, write the measurement claim: construct, system class, task distribution, assumptions, protocol, and metric.
Second, define the target system. Are we evaluating a base model, chat model, agent scaffold, retrieval-augmented system, or full product? Tools, memory, browsing, and code execution belong in the protocol.
Third, build a task taxonomy. Without taxonomy, the final score hides capability shape.
Fourth, choose the sampling strategy. Representative, difficult, adversarial, live, and taxonomy-balanced sampling serve different goals.
Fifth, specify the evaluation protocol. For MCQ tasks, this includes prompt template, option order, answer format, few-shot examples, decoding settings, logprob extraction, parser behavior, and invalid-output policy. For open-ended tasks, it includes judge prompts, rubric, human review, and aggregation.
Sixth, choose multiple metrics. For MCQ, report accuracy, Brier score, NLL, calibration, selective accuracy, invalid rate, and subgroup performance. For agents, report success, cost, steps, tool errors, safety violations, and variance.
Seventh, run baselines: random, weak model, strong model, and human when possible.
Eighth, estimate uncertainty with confidence intervals, paired comparisons, and repeated-run variance.
Ninth, analyze errors. The unsolved set is where the benchmark often becomes scientifically useful.
Tenth, protect integrity. Decide what should be public, private, delayed, or live.
Eleventh, plan maintenance and retirement. Benchmarks saturate, leak, age, and drift away from real use.
A small blueprint for an AI safety benchmark
If I were designing my own benchmark, I would avoid starting with “general AI safety.” That construct is too broad. I would begin with:
calibrated refusal and safe redirection under dual-use scientific prompts.
This benchmark would test whether models can distinguish benign educational science questions from harmful operational assistance while preserving helpfulness on safe requests.
The taxonomy could include benign explanations, lab safety, ambiguous dual-use questions, clearly harmful operational requests, prompt-injection attempts, fictionalized harmful requests, multi-turn escalation, and cross-lingual phrasing.
The metrics would include harmful compliance rate, over-refusal rate, safe-helpfulness score, calibration on risk labels, paraphrase consistency, multi-turn degradation, judge-human agreement, and worst-category performance.
The protocol would use a hidden test set, paraphrase families, human-labeled risk categories, validated model judges, and confidence intervals by category. It would not claim to measure AI safety in general. It would measure one scoped safety construct under explicit assumptions.
That is the kind of benchmark I trust more: narrow, explicit, statistically reported, and honest about what it cannot measure.
Checklist
Before trusting or building a benchmark, I want to ask:
- What construct does this benchmark claim to measure?
- What is the target system: model, scaffold, agent, or product?
- What task distribution is the dataset supposed to sample from?
- Is the sampling representative, difficult, adversarial, or live?
- What metric is used, and what behavior does it reward?
- Is there a confidence-aware or calibration metric?
- Are subgroup scores reported, or only an aggregate?
- Are confidence intervals or paired tests reported?
- Are model disagreements analyzed?
- Are shared failures inspected for dataset errors?
- Is contamination checked?
- Is the judge or rubric validated?
- Are the baselines strong enough?
- Is the evaluation protocol reproducible?
- Is there a maintenance or retirement plan?
If most answers are missing, the benchmark score should be treated as a weak signal.
Closing thought
Benchmarking is not just a technical convenience. It is a scientific and institutional practice. The things we measure become the things labs optimize, papers report, and policymakers cite.
For AI safety, the danger is not only that models perform badly. The danger is that we build benchmarks that reward the wrong behavior, give false confidence, or hide the failures that matter.
A good benchmark makes model behavior more legible. A great benchmark also makes its own assumptions legible.
References and readings
Martin Ziqiao Ma, Xiang Yue, and Michael Saxon. Tutorial on the Science of Benchmarking: What’s Measured? What’s Missed? What’s Next? NeurIPS Tutorial, 2025.
Inioluwa Deborah Raji et al. “AI and the Everything in the Whole Wide World Benchmark.” NeurIPS Datasets and Benchmarks, 2021.
Anka Reuel et al. “BetterBench: Assessing AI Benchmarks, Uncovering Issues, and Establishing Best Practices.” NeurIPS, 2024.
Carlos E. Jimenez et al. “SWE-bench: Can Language Models Resolve Real-World GitHub Issues?” ICLR, 2024.
Alex Wang et al. “GLUE: A Multi-Task Benchmark and Analysis Platform for Natural Language Understanding.” 2018.
Alex Wang et al. “SuperGLUE: A Stickier Benchmark for General-Purpose Language Understanding Systems.” NeurIPS, 2019.
Dan Hendrycks et al. “Measuring Massive Multitask Language Understanding.” ICLR, 2021.
François Chollet. “On the Measure of Intelligence.” 2019.
Naman Jain et al. “LiveCodeBench: Holistic and Contamination Free Evaluation of Large Language Models for Code.” ICLR, 2025.
Michael Saxon et al. “Benchmarks as Microscopes: Toward a Science of Model Metrology.” 2024.